


As an HR professional, you need your finger on the pulse of employee loyalty. But guesswork won’t cut it.
eNPS surveys give you the power to know – with precision math.
These simple surveys measure employees’ willingness to rave about your company. On a 0-10 scale, they answer:
“How likely are you to recommend [Company] as a place to work?”

9-10s are Promoters – your loyal brand advocates. 7-8s are neutral. And 0-6s are at-risk Detractors.
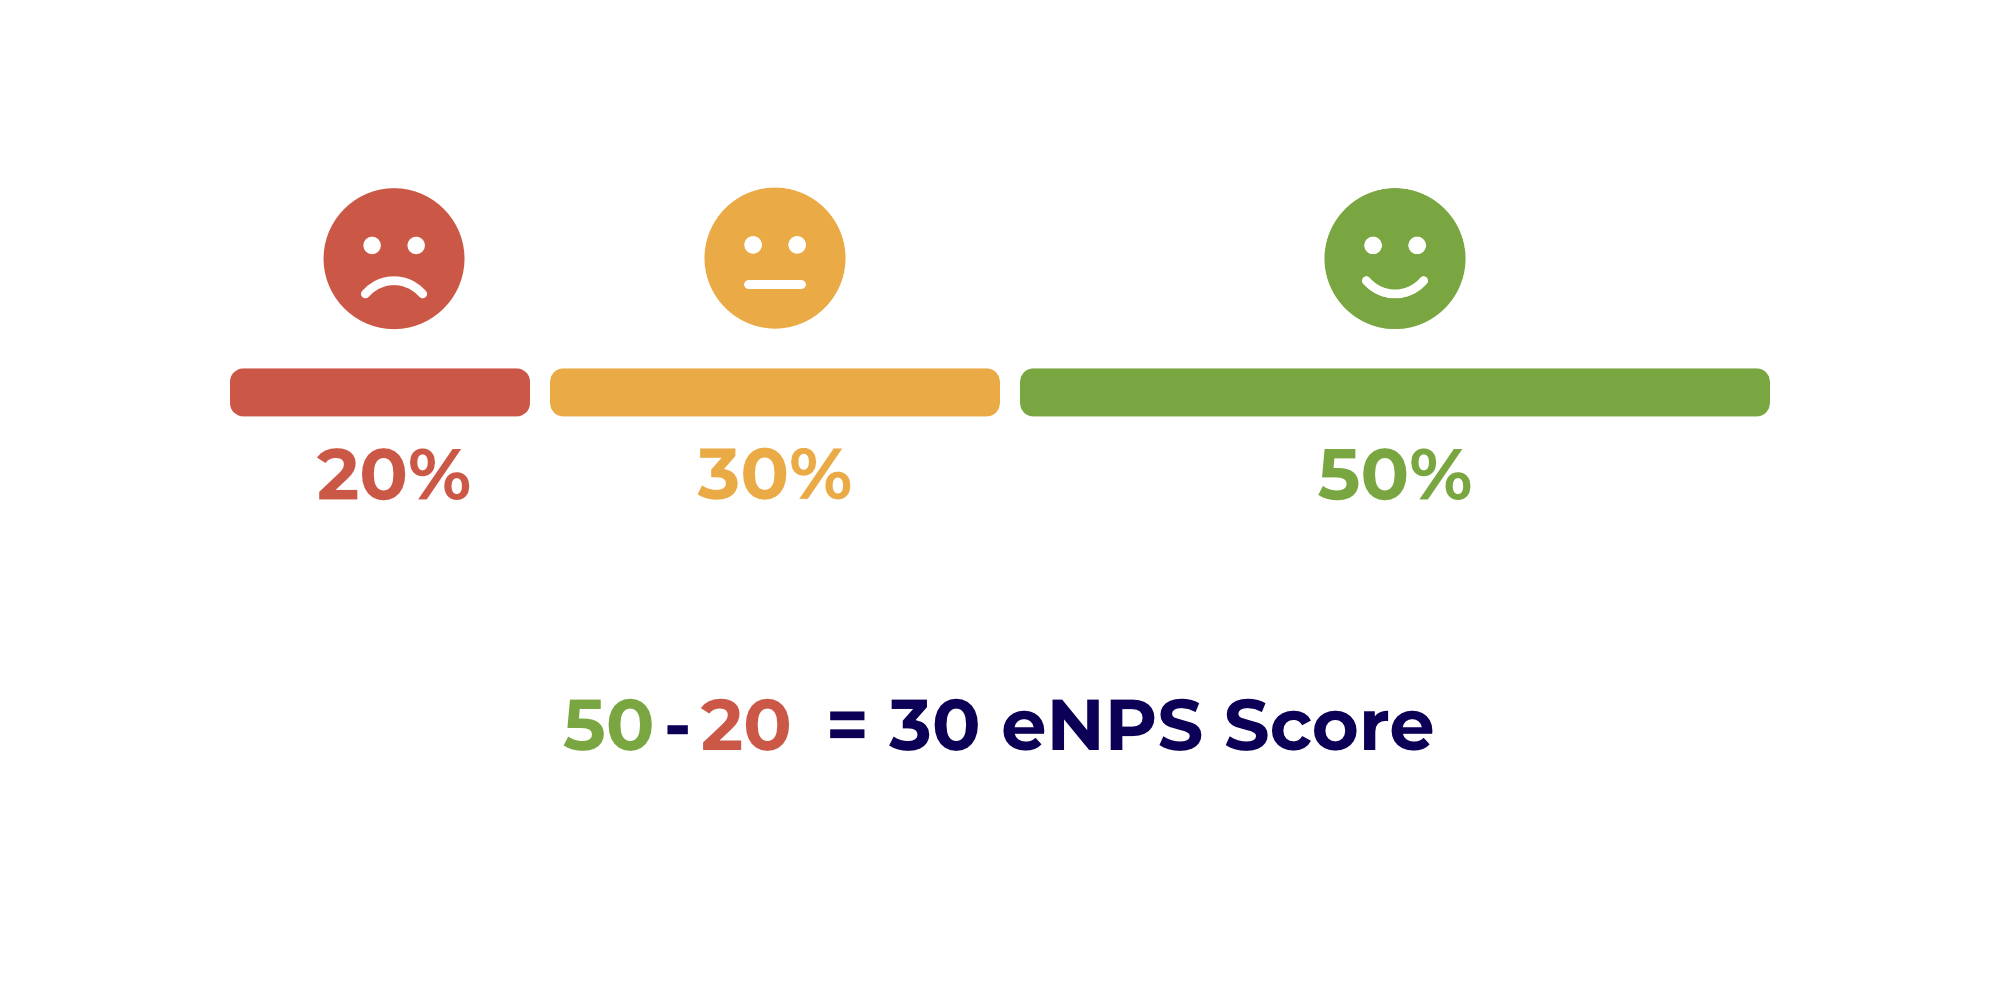
The eNPS math is simple. Take the total percentage of Promoters who rave about your company with 9s or 10s. Then subtract the total percentage of Detractors who are clearly disengaged with their 0-6 scores. The result is your eNPS. For example, if 50% of your people are Promoters and 20% are Detractors, your eNPS is 30. This clear snapshot shows you exactly where you stand when it comes to employee advocacy. No more reading tea leaves – just an actionable metric powered by your people’s voices.

Subtract Detractors from Promoters to get your eNPS. The higher your score, the stronger your employer brand and culture.
For context, good employers hit +40 to +60 eNPS. Below zero? That’s a big red flag to address sharpish.

With quick, regular eNPS pulses, you’ll stay on top of evolving sentiment. Then dig into follow-ups to pinpoint friction points. Your actions transform based on real-time insights from your people.
So don’t settle for guesswork and ancient annual surveys. Take the guesswork out of the equation with eNPS. And turn employee whispers into roars.
If improving retention, referrals and employer brand are priorities for you, consider making eNPS surveys a regular practice. Get in touch to understand how Wotter’s eNPS module can automate the analytics for you, giving you the data you need to foster some incredible employee engagement!